Electric vs Diesel Equipment TCO Analysis: 2025 Research Report
A comprehensive total cost of ownership analysis reveals that electric equipment has reached cost parity with diesel in specific applications, while significant gaps remain in others—making careful application matching essential for sound investment decisions.
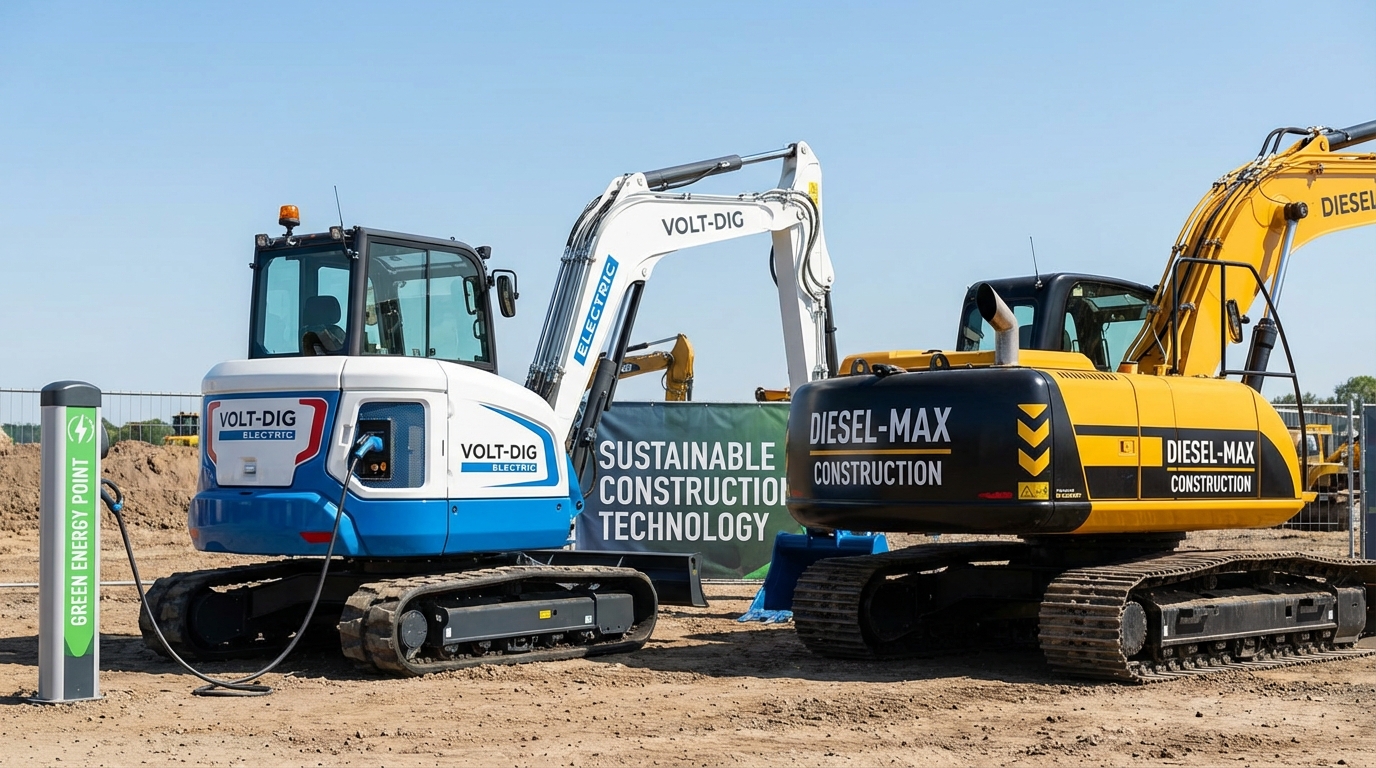
Electric construction equipment has moved from experimental technology to commercial reality, with every major manufacturer now offering battery-electric options in compact equipment categories and developing larger machines. But the fundamental question for contractors remains: does electric equipment make financial sense for my operation?
This comprehensive total cost of ownership (TCO) analysis examines the economics of electric versus diesel equipment across applications, providing frameworks for sound investment decisions.
Research Approach
This analysis synthesizes data from multiple sources:
Equipment cost data: Manufacturer pricing, dealer inputs, and transaction data for comparable diesel and electric models.
Operating cost research: Fuel, electricity, and maintenance cost data from fleet operators running both technologies.
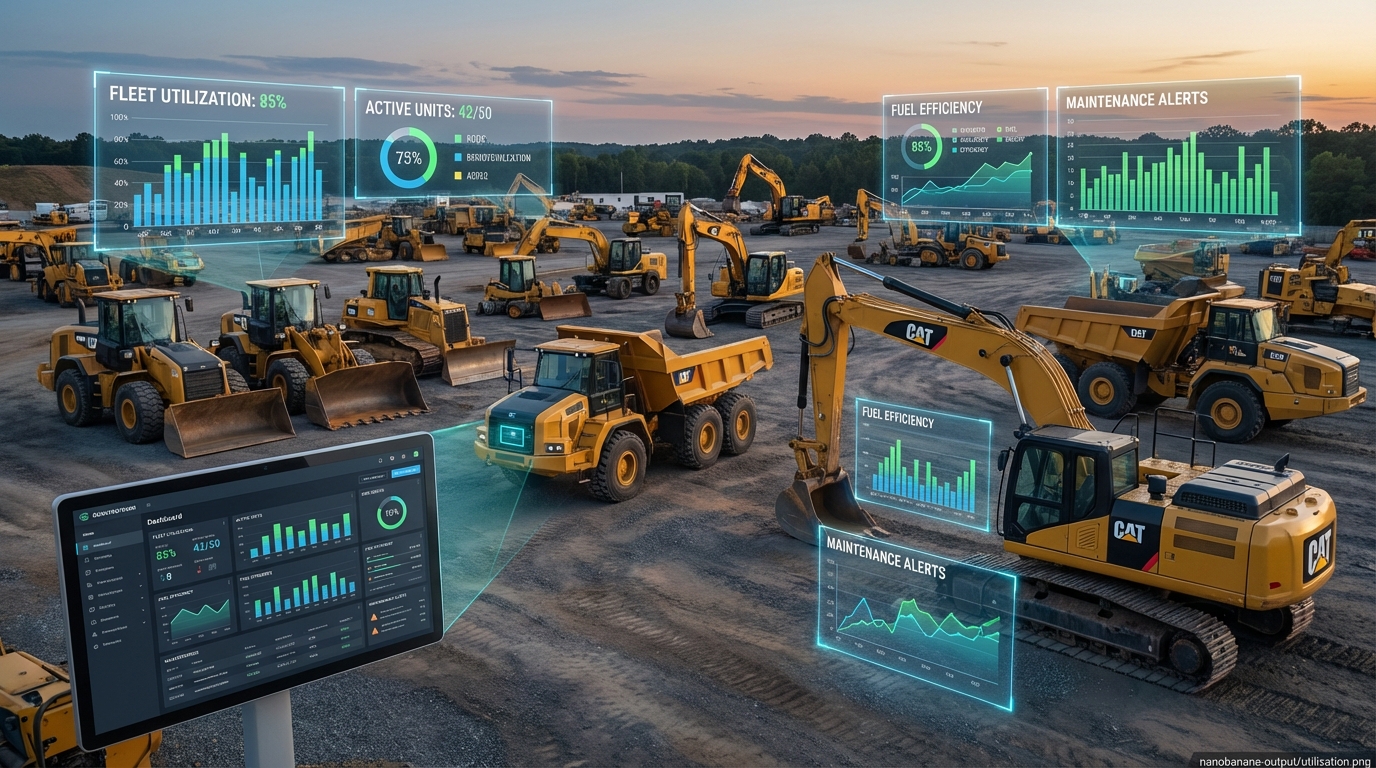
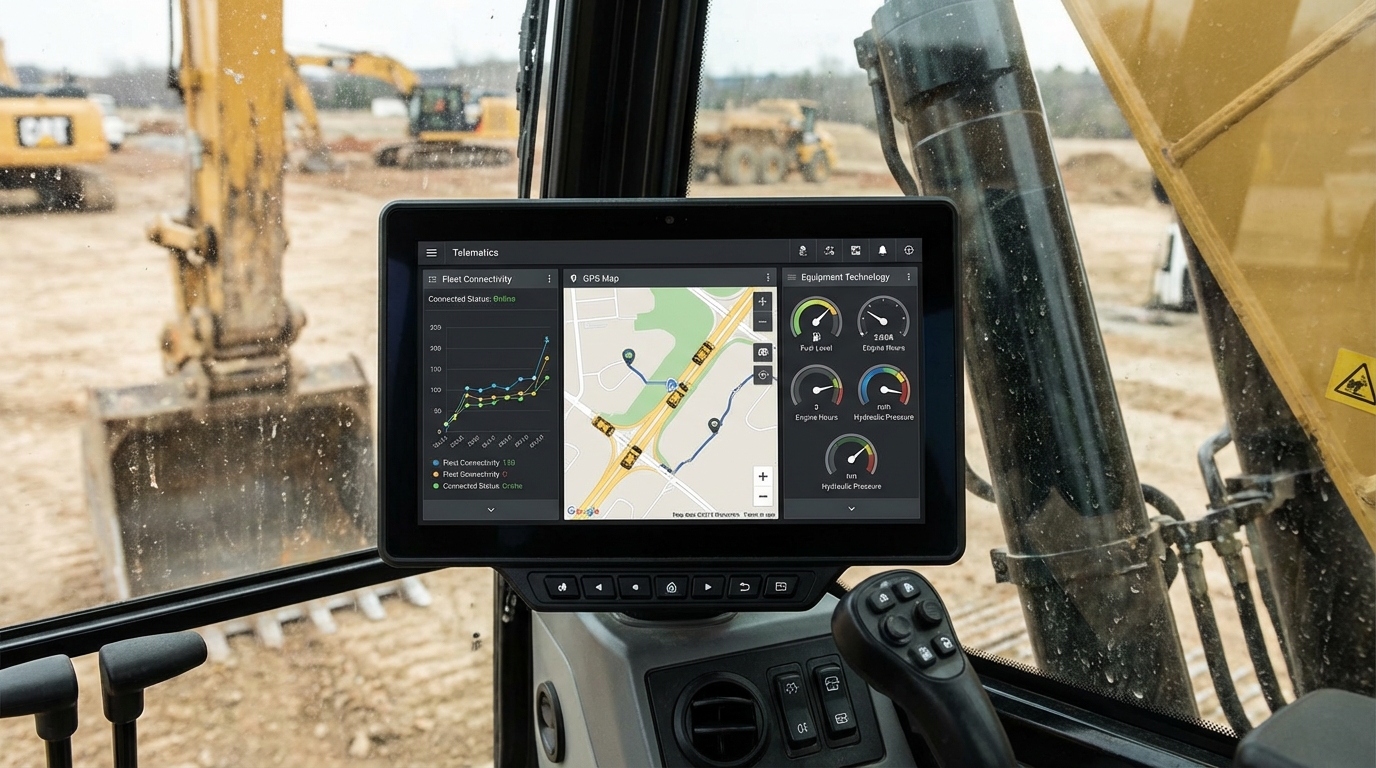
Utilization patterns: Real-world utilization data from telematics-equipped fleets.
Incentive analysis: Federal, state, and utility incentive program evaluation.
Equipment categories: Analysis spanning mini excavators, compact track loaders, wheel loaders, and telehandlers.
Purchase Price Comparison
Initial acquisition costs differ substantially:
Current Price Premiums
Electric equipment purchase price premiums:
Mini excavators (under 4 ton): Electric premium of 40-60% over comparable diesel models.
Compact track loaders: Electric premium of 55-70% over diesel equivalents.
Small wheel loaders: Electric premium of 50-65% for available models.
Telehandlers: Electric premium of 45-55% for models currently available.
Price Trend Trajectory
Premium trajectory:
Historical trend: Premiums have declined 15-20% over the past three years.
Projected trend: Industry analysts project continued 5-8% annual premium reduction.
Battery costs: Battery costs—the primary driver of premium—continue declining.
Scale effects: Increased production volumes will further reduce costs.
Incentive Impact
Available incentives significantly affect effective prices:
Federal incentives: Various federal programs support clean equipment purchase.
State incentives: California, New York, and other states offer substantial rebates.
Utility incentives: Some utilities offer equipment and charging incentives.
Net effect: Available incentives can reduce effective premiums by 20-40% in some jurisdictions.
Fuel and Energy Costs
Energy costs favor electric equipment substantially:
Fuel Cost Analysis
Diesel fuel cost factors:
Current diesel prices: National average approximately $3.70/gallon with significant regional variation.
Price volatility: Diesel prices have shown 30%+ annual variation in recent years.
Fuel consumption: Typical compact equipment consumes 1-3 gallons per operating hour.
Fuel cost per hour: $3.70-11.00 per operating hour depending on equipment size and application.
Electricity Cost Analysis
Electric charging cost factors:
Electricity rates: Commercial rates averaging $0.12-0.18/kWh nationally.
Rate variation: Significant variation from $0.08 in some markets to $0.25+ in others.
Charging efficiency: Typical charging efficiency of 85-90%.
Energy cost per hour: $1.50-4.00 per operating hour depending on equipment size and local rates.
Comparative Advantage
Electric energy cost advantages:
Cost savings: Electric energy costs typically 50-70% lower than diesel fuel.
Stability: Electricity prices more stable than volatile diesel.
Peak/off-peak opportunity: Charging during off-peak periods can further reduce costs.
On-site generation: Solar or other on-site generation can dramatically reduce energy costs.
Maintenance Cost Comparison
Maintenance economics differ significantly:
Diesel Maintenance Requirements
Diesel maintenance cost components:
Engine service: Oil changes, filters, and routine engine maintenance.
Cooling system: Coolant service and component maintenance.
Exhaust aftertreatment: DPF regeneration, DEF consumption, and aftertreatment service.
Fuel system: Injector service and fuel system maintenance.
Typical costs: $8-15 per operating hour for comprehensive maintenance on compact equipment.
Electric Maintenance Requirements
Electric maintenance cost components:
Reduced requirements: No engine oil, coolant, exhaust aftertreatment, or fuel system service.
Remaining maintenance: Hydraulics, undercarriage, and electrical systems still require service.
Battery considerations: Battery degradation and eventual replacement must be considered.
Typical costs: $4-8 per operating hour, representing 40-50% reduction from diesel.
Maintenance Advantage
Net maintenance comparison:
Near-term savings: Electric equipment shows clear maintenance savings in early ownership years.
Long-term considerations: Battery replacement costs (if required) affect lifetime calculations.
Battery warranty: Most manufacturers offer 5-8 year battery warranties, transferring early-life risk.
Total Cost of Ownership Modeling
TCO analysis integrates all cost components:
Modeling Assumptions
Key analysis assumptions:
Ownership period: 5-year ownership period for primary analysis.
Utilization: 1,000 operating hours annually (typical for compact equipment).
Discount rate: 7% discount rate for present value calculations.
Residual value: Assumption of 40% residual for diesel, 35% for electric (less certain market).
Mini Excavator TCO Comparison
TCO analysis for 3-ton excavator class:
Diesel 5-year TCO: Approximately $145,000 including acquisition, fuel, maintenance, and net of residual.
Electric 5-year TCO: Approximately $138,000 with incentives, $165,000 without incentives.
Break-even: Electric reaches parity at approximately 1,100 annual hours with incentives; 1,600+ hours without.
Compact Track Loader TCO Comparison
TCO analysis for compact track loader:
Diesel 5-year TCO: Approximately $165,000 for typical ownership pattern.
Electric 5-year TCO: Approximately $155,000 with incentives, $185,000 without incentives.
Break-even: Electric competitive at 1,200+ annual hours with incentives.
Sensitivity Analysis
Key variables affecting results:
Utilization: Higher utilization strongly favors electric due to energy savings leverage.
Fuel price: Diesel price increases improve electric competitiveness; decreases favor diesel.
Electricity rates: High electricity markets reduce electric advantage.
Incentives: Incentive availability significantly affects break-even calculations.
Application Suitability Assessment
Beyond pure TCO, application characteristics affect suitability:
Favorable Electric Applications
Applications where electric excels:
Indoor/enclosed work: Zero emissions essential; electric is often the only option.
Urban/noise-sensitive: Quiet operation valued; electric preferred.
Consistent light/medium duty: Predictable energy consumption; charging feasible.
Short transport distances: Limited range less problematic.
Available charging infrastructure: On-site power readily available.
Challenging Electric Applications
Applications where diesel remains advantageous:
Remote locations: Charging infrastructure unavailable.
Extended shift requirements: Battery capacity insufficient for full shifts at high utilization.
Heavy continuous duty: High power demand exceeds current battery capabilities.
Cold weather operations: Battery performance degradation and cab heating demands.
Multi-shift operations: Insufficient charging time between shifts.
Transition Applications
Applications where electric is becoming viable:
Moderate outdoor work: As battery capacity increases, outdoor applications expanding.
Single-shift operations: Current battery technology supports typical 8-hour shifts.
Projects with power access: Jobsites with electrical infrastructure can support charging.
Charging Infrastructure Considerations
Infrastructure requirements affect practical viability:
Infrastructure Requirements
Charging infrastructure needs:
Level 2 charging: 240V charging suitable for overnight charging; lower infrastructure cost.
DC fast charging: Higher power for faster charging; significantly higher infrastructure cost.
On-site power: Adequate electrical service at charging locations required.
Multiple units: Fleet charging requires planning for simultaneous charging needs.
Infrastructure Costs
Investment requirements:
Level 2 installation: $2,000-5,000 per charging position typical.
DC fast charging: $30,000-80,000+ per position depending on power level.
Service upgrades: Electrical service upgrades may be required; costs vary widely.
Portable options: Portable charging solutions available for remote locations.
Fleet Charging Strategy
Managing fleet charging:
Overnight charging: Aligns charging with off-peak rates and natural downtime.
Rotation planning: Scheduling equipment rotation to accommodate charging.
Opportunity charging: Partial charging during breaks and downtime.
Mobile charging: Emerging mobile charging solutions for remote sites.
Market and Regulatory Factors
External factors affecting electric equipment adoption:
Regulatory Drivers
Regulations pushing electrification:
California regulations: CARB regulations increasingly requiring zero-emission equipment.
Other states: Northeastern states and others following California’s lead.
Project requirements: Green building and sustainability requirements specifying electric equipment.
Emission zones: Low/zero emission zones in some urban areas.
Incentive Programs
Available financial incentives:
Federal programs: Various federal programs supporting clean equipment.
State rebates: California’s CORE program and similar state programs offer substantial rebates.
Utility programs: Utility incentives for equipment and charging infrastructure.
Tax benefits: Accelerated depreciation and tax credit opportunities.
Resale Market Development
Residual value considerations:
Limited history: Electric equipment resale market is nascent; residual value uncertain.
Expected trajectory: Residual values expected to strengthen as market matures.
Technology risk: Rapid technology evolution creates some obsolescence risk.
Decision Framework
Framework for evaluating electric equipment investment:
Key Questions
Questions to evaluate:
Application match: Does the application align with electric equipment capabilities?
Utilization level: Is utilization high enough to leverage operating cost savings?
Infrastructure feasibility: Is charging infrastructure available or feasible?
Incentive availability: What incentives are available to offset purchase premium?
Total cost comparison: Does TCO analysis favor electric for this specific application?
Adoption Strategies
Approaches to electric adoption:
Pilot programs: Start with applications most favorable to electric; learn and expand.
Mixed fleets: Integrate electric where advantageous; maintain diesel for challenging applications.
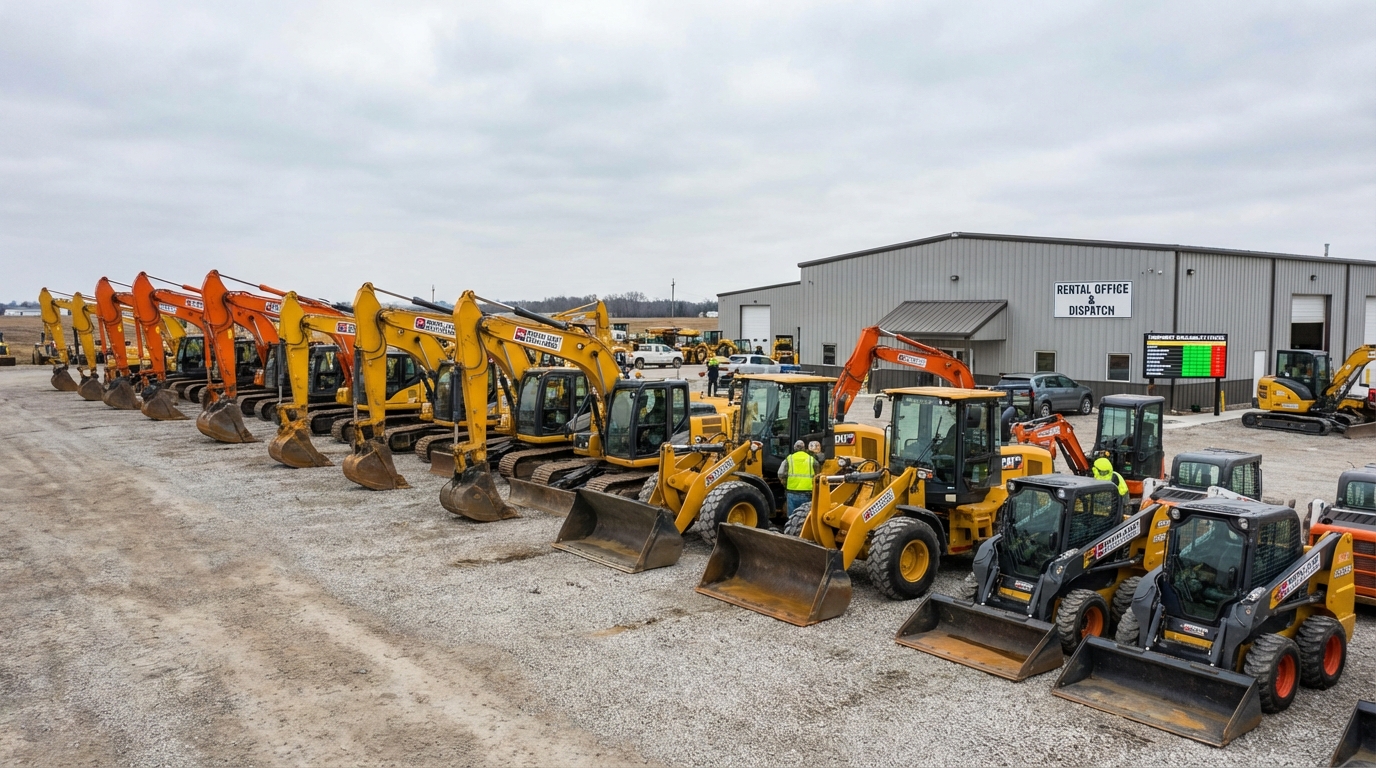
Rental evaluation: Use rental to evaluate electric equipment before purchase commitment.
Phased transition: Plan multi-year transition as equipment naturally turns over.
Looking Ahead
Electric construction equipment has reached an inflection point. TCO analysis now supports electric adoption in specific applications, particularly with available incentives. However, significant gaps remain for demanding applications and locations without adequate infrastructure.
For contractors, the question is no longer whether to consider electric equipment, but which applications to prioritize and how to integrate electric machines into their fleets effectively. Careful analysis of specific use cases, available incentives, and infrastructure requirements leads to sound investment decisions.
For related coverage, see our analysis of total cost of ownership methodology and electric equipment technology trends.