2025 Fleet Utilization Study: Maximizing Equipment Uptime and Productivity
A comprehensive analysis of telematics data from over 50,000 machines reveals that average fleet utilization remains below 50%, representing significant opportunity for productivity improvement and cost reduction.

Equipment utilization—the percentage of available time that machines actually work—remains one of the most impactful yet frequently overlooked metrics in fleet management. A new comprehensive study analyzing telematics data from over 50,000 construction and industrial machines reveals that most fleets operate well below optimal utilization levels, representing substantial opportunity for improvement.
Understanding utilization benchmarks and the factors driving performance helps fleet managers identify optimization opportunities within their own operations.
Study Methodology
The 2025 Fleet Utilization Study analyzed telematics data from equipment operating across diverse construction, infrastructure, and industrial applications:
Sample size: Telematics data from 52,347 machines across 847 fleets.
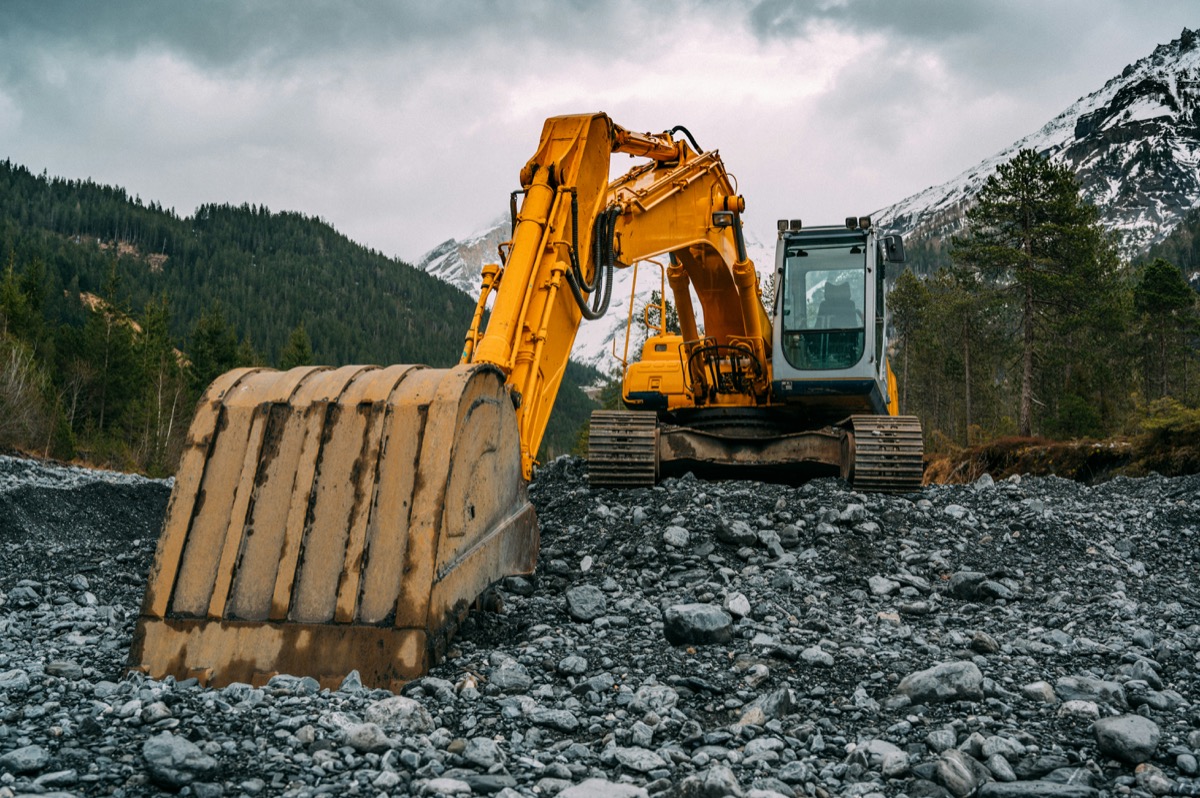
Equipment types: Excavators, wheel loaders, dozers, motor graders, compact equipment, and material handlers.
Geographic coverage: Primarily North American operations, with some international comparison data.
Time period: 12 months of continuous operational data.
Data sources: Major telematics platforms with fleet owner consent for anonymized analysis.
Key Utilization Findings
The study revealed significant variation in utilization performance:
Average Utilization Rates
Overall utilization averages were lower than industry expectations:
Overall average: 41.3% of available hours showed engine running.
Active work percentage: Of engine-running time, only 67% involved actual productive work (movement, loading, digging). The remainder was idle time.
Effective utilization: Combining these factors, average effective utilization was approximately 28% of available time.
This means the typical machine sits unused or idle for over 70% of its available hours.
Variation by Equipment Type
Utilization varied substantially by equipment category:
Excavators: Average 44% utilization, highest among major categories. Excavator versatility keeps them in demand across project phases.
Wheel loaders: Average 39% utilization. Often held in reserve for material handling flexibility.
Dozers: Average 36% utilization. Site prep focus means limited use outside earthwork phases.
Motor graders: Average 31% utilization. Specialized applications limit versatility.
Compact equipment: Average 47% utilization. Easier redeployment and lower transport costs support higher utilization.
Top Performer Characteristics
The top quartile of fleets achieved dramatically better results:
Top 25% average: 61% utilization, representing 48% improvement over overall average.
Top 10% performance: Above 70% utilization, demonstrating what’s achievable.
Common characteristics: Shared traits including active utilization monitoring, flexible equipment allocation, and equipment right-sizing.
Idle Time Analysis
Idle time—engine running without productive work—represents a distinct improvement opportunity:
Idle Time Prevalence
Idle time is substantial across most fleets:
Average idle percentage: 33% of engine-running time is idle time.
Idle cost impact: Idle time consumes fuel, accumulates hours, and accelerates maintenance without producing work.
Carbon impact: Idle emissions contribute to environmental footprint without productive output.
Idle Time Causes
Common causes of excessive idle include:
Waiting for loads: Equipment waiting for trucks or material.
Operator breaks: Engine left running during breaks and meetings.
Warm-up periods: Extended warm-up beyond manufacturer requirements.
End-of-shift: Equipment running awaiting shutdown.
Conditioned cabs: Engine running solely for cab climate control.
Idle Reduction Strategies
Successful idle reduction approaches include:
Automatic shutdown: Engine auto-shutdown after specified idle periods.
Operator awareness: Training and accountability for idle time management.
Work coordination: Better scheduling to reduce waiting time.
Auxiliary systems: Battery-powered cab climate systems reducing need for engine idling.
Downtime Analysis
Unplanned downtime affects utilization significantly:
Downtime Statistics
Downtime patterns revealed:
Average unplanned downtime: 8.3% of scheduled operating time lost to unplanned equipment unavailability.
Mean time between failures: Wide variation from 200 hours for poorly maintained fleets to over 1,000 hours for best-maintained equipment.
Repair duration: Average repair duration of 3.2 days, with significant variation by issue type and parts availability.
Downtime Causes
Leading downtime causes included:
Hydraulic system issues: Leading category representing 23% of unplanned downtime.
Electrical and electronic faults: Growing category as equipment becomes more complex.
Undercarriage wear: Significant for tracked equipment.
Engine and powertrain: Less frequent but longer duration when occurring.
Predictive Maintenance Impact
Fleets using predictive maintenance showed advantages:
Reduced unplanned downtime: 31% less unplanned downtime compared to reactive maintenance approaches.
Shorter repair duration: Issues identified early typically require less extensive repair.
Parts availability: Advance warning enables proactive parts procurement.
Utilization Improvement Strategies
The study identified strategies correlated with higher utilization:
Equipment Right-Sizing
Fleet composition matters:
Matching equipment to work: Fleets with equipment sized appropriately for typical tasks showed higher utilization.
Avoiding over-specification: Over-sized equipment for typical applications reduces utilization by limiting deployment flexibility.
Flexibility consideration: Some “buffer” capacity provides operational flexibility, but excessive buffer reduces utilization.
Flexible Deployment
Redeployment practices affect utilization:
Project-to-project movement: Willingness to move equipment between projects as needs change.
Regional coordination: Larger organizations coordinating equipment across regions showed higher fleet utilization.
Rental supplementation: Using rental for peak needs rather than maintaining owned equipment for maximum requirements.
Technology Enablement
Technology supporting utilization improvement:
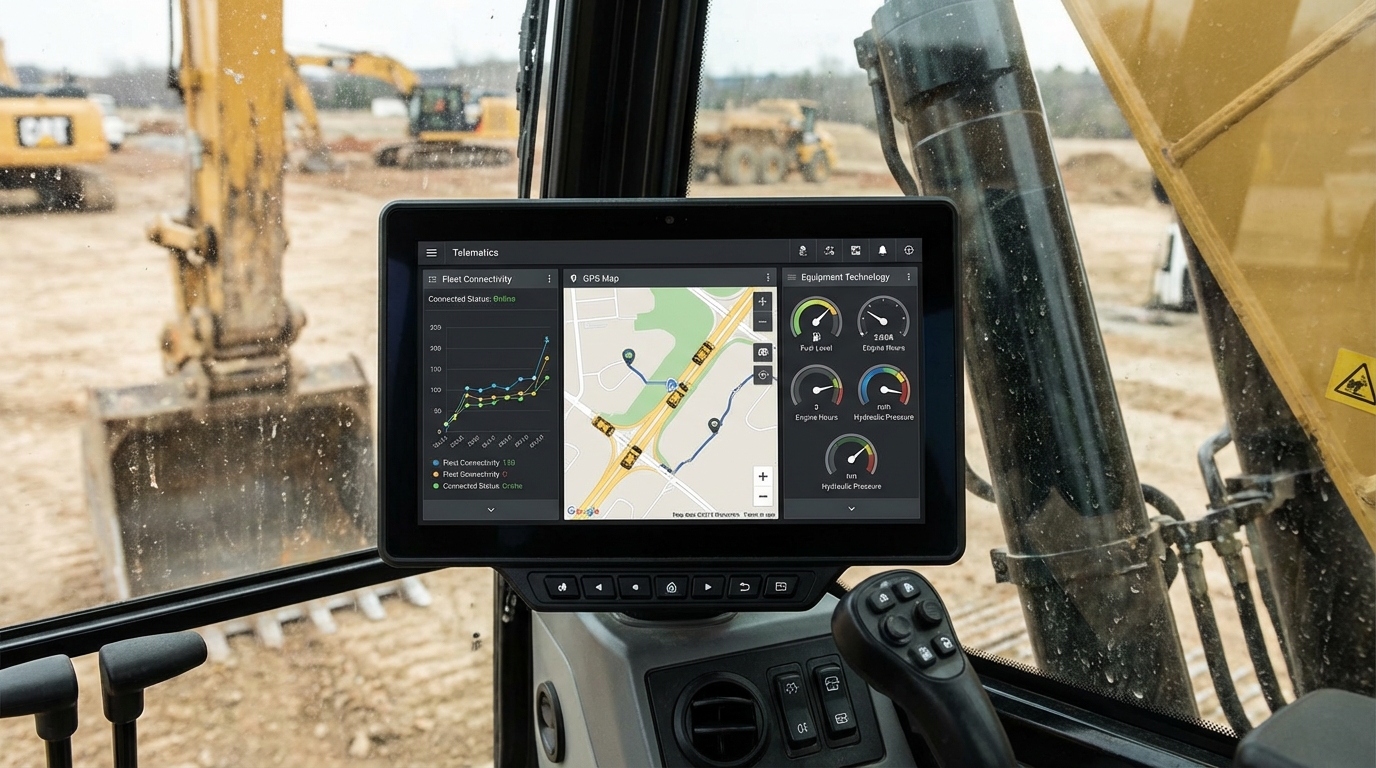
Telematics visibility: Basic requirement for understanding current utilization.
Dispatch integration: Technology connecting equipment availability with project requirements.
Automated alerts: Notifications when equipment sits unused beyond thresholds.
Organizational Factors
Organizational practices matter:
Clear ownership: Designated responsibility for fleet utilization performance.
Metrics and accountability: Regular utilization reporting with accountability for performance.
Cross-functional coordination: Collaboration between project management and equipment functions.
Rental vs. Ownership Analysis
The study examined rental/ownership decisions:
Break-Even Utilization
Analysis identified utilization levels favoring ownership:
General threshold: Ownership typically becomes favorable above 50-60% utilization for standard equipment.
Equipment-specific variation: Break-even varies substantially by equipment type, with larger equipment often requiring higher utilization to justify ownership.
Market conditions: Rental rates and equipment values affect specific break-even calculations.
Optimal Fleet Strategy
Data suggested optimal approaches:
Core fleet ownership: Own equipment expected to exceed break-even utilization consistently.
Rental for peaks and specialty: Use rental for peak requirements and specialized equipment.
Continuous evaluation: Regularly evaluate utilization against break-even and adjust fleet composition.
Regional Variation
Geographic patterns emerged:
Seasonal markets: Regions with strong seasonality showed lower annual utilization but often higher in-season rates.
Urban vs. rural: Urban fleets showed slightly higher utilization, possibly due to shorter mobilization distances.
Market activity: Utilization correlated with regional construction activity levels.
Benchmarking Framework
For contractors evaluating their own fleets, the study suggests benchmarking approach:
Target Setting
Reasonable improvement targets:
Below 30% utilization: Significant fleet restructuring opportunity. Consider disposition of underutilized equipment.
30-45% utilization: Meaningful improvement opportunity through operational changes.
45-60% utilization: Room for optimization; approaching reasonable performance.
Above 60% utilization: Strong performance; focus on maintaining and incremental improvement.
Metric Tracking
Recommended metrics for ongoing monitoring:
Monthly utilization by machine: Track individual equipment performance.
Idle time percentage: Monitor and target idle time reduction.
Unplanned downtime: Track reliability and maintenance effectiveness.
Cost per operating hour: Combine utilization with cost data for complete picture.
Looking Ahead
The 2025 Fleet Utilization Study confirms that most fleets have substantial room for improvement in how they deploy their equipment assets. Even modest utilization gains—moving from 40% to 50%—can significantly reduce effective equipment costs and potentially defer capital expenditures.
With telematics making utilization data increasingly accessible, contractors have the visibility needed to identify and act on optimization opportunities. The question is whether organizations prioritize utilization improvement and implement the practices that drive better performance.
For related coverage, see our analysis of telematics adoption trends and total cost of ownership.