Construction Spending Is Down, but Equipment Demand Is Splitting in Two
June construction data shows broad weakness beside real pockets of growth. Contractors should read the mix before buying, selling, or relocating equipment.
The construction market did not collapse in June. It did something harder for equipment owners to manage: it split.
Total U.S. construction spending ran at a seasonally adjusted annual rate of $2.167 trillion in June 2026, according to the U.S. Census Bureau’s latest Value of Construction Put in Place data. That was nearly flat from May, down 0.1%, but 3.2% below June 2025.
That top-line decline is real. It is also too broad to guide a fleet decision. Underneath it, private manufacturing construction was down 22% from a year earlier while private office spending was up 15.1%. Public highway and street work rose 3.1%. Private power construction gained 4.3%. Conservation and development work jumped more than 30%.
One contractor can be staring at idle machines while another is short on iron. Both can be reading the same national report accurately.
FieldFix Editor’s Note: A split market makes machine-level numbers more important. FieldFix helps equipment owners track hours, service history, downtime, repair spend, and cost per hour, so fleet moves are based on what each asset is doing rather than a national headline.
The headline says contraction
June’s $2.167 trillion annual rate was down from $2.238 trillion in June 2025. Residential construction, at $889.4 billion, fell 4.7% year over year. Nonresidential construction held up better at $1.277 trillion, but it was still down 2.1%.
Private construction accounted for most of the weakness. The June annual rate of $1.622 trillion was 4.7% below the prior year. Public construction moved the other direction, reaching $544.1 billion and rising 1.7%.
The difference matters to anyone who owns excavators, loaders, dozers, cranes, trucks, or compact equipment. Private work often changes direction faster when borrowing costs, tenant demand, or corporate capital plans shift. Public work can move slowly through planning and procurement, then create durable demand once projects are funded and released.
The result is not one clean cycle. It is several cycles happening at once.
Private residential work was down 4.7%. Private commercial spending fell 5.3%. Private lodging declined 8.6%. Those figures point to softer demand in segments that support site contractors, concrete crews, utility installers, material suppliers, and rental yards serving smaller commercial and development work.
Then there is manufacturing.
The factory boom is losing altitude
Private manufacturing construction ran at a $170.3 billion annual rate in June. A year earlier, it was $218.3 billion. That 22% decline is the sharpest major drop in the report and a major reason the national total looks weak.
This does not mean every large factory project stopped. Construction spending measures work put in place, not project announcements or the total value printed in a press release. A falling annual rate can reflect large projects passing peak construction, delayed starts, revised schedules, or fewer new projects replacing work that is finishing.
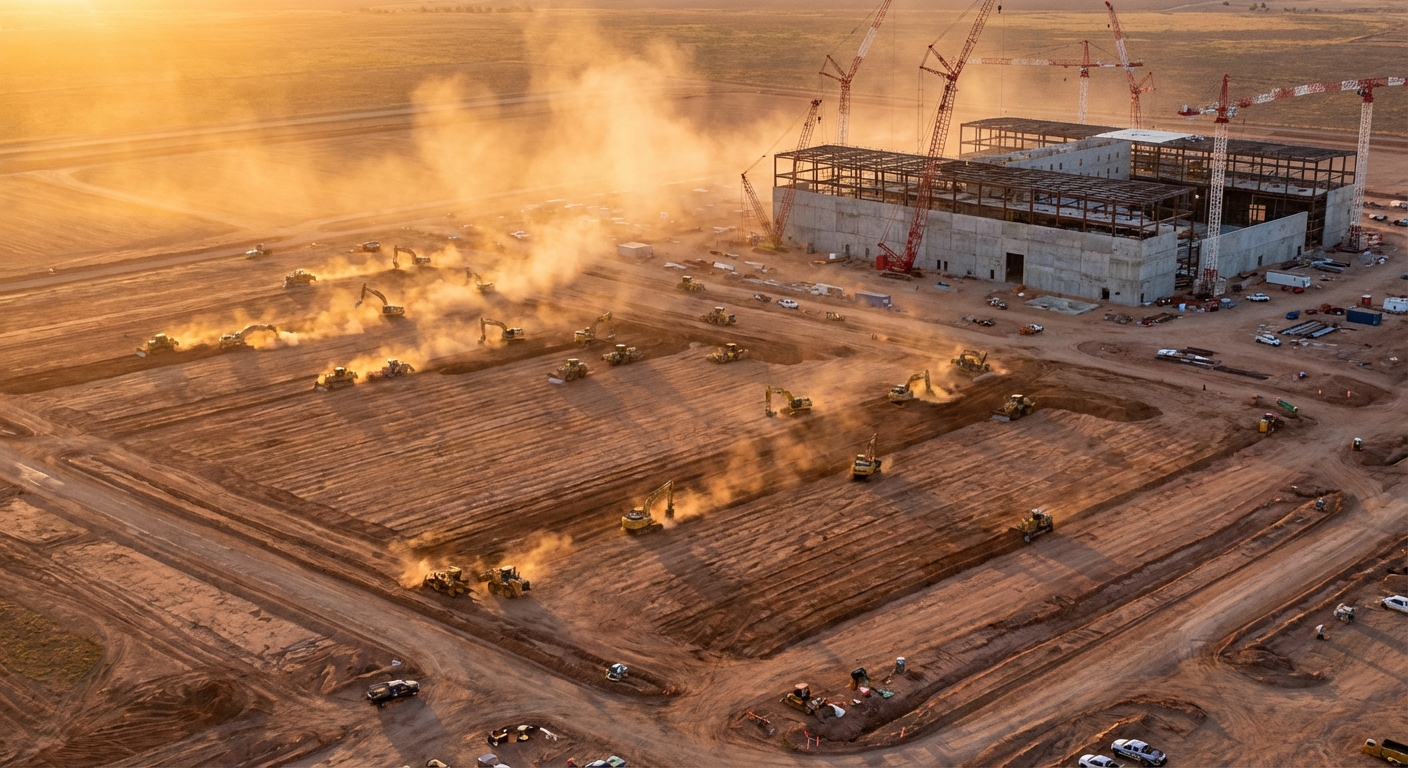
For equipment owners, the distinction is practical. A megaproject can absorb large fleets during earthwork and civil construction, then require a different equipment mix as the job moves into structural and interior phases. The project can remain active while demand for articulated trucks, big excavators, dozers, and mass grading support falls.
Dealers and rental companies near major manufacturing corridors should pay attention to phase as much as project count. A market full of announced plants does not guarantee that every unit currently on rent will roll into another long civil package. Fleet managers need to know which projects are still moving dirt, which are pouring foundations, and which have moved beyond the equipment-heavy stage.
Contractors should use the same discipline. Buying a large production machine because the local market has several billion-dollar projects is weak reasoning unless the company can identify the packages it can actually win and the months when that machine will work.
Office growth does not mean office is healthy everywhere
Private office construction posted the strongest large private-sector gain in June, rising 15.1% from a year earlier to an annual rate of $115.8 billion. The Census Bureau tracks data centers within the private office category, which makes the label easy to misread.
Traditional office development still faces uneven demand in many cities. The growth in this category should not be treated as proof of a broad return to speculative office towers. It is more useful as evidence that certain office-classified projects, including expensive data infrastructure, are pulling spending upward.
That changes the equipment mix. Data center and related utility work can create demand for site preparation, underground utilities, electrical infrastructure, backup power systems, cooling support, road access, and extensive material handling. It can favor contractors that can meet strict schedules and safety requirements, document production, and support high utilization without letting maintenance slide.
It can also concentrate demand geographically. A national office gain does little for a contractor hundreds of miles from the active clusters. Local permit data, utility interconnection activity, awarded civil packages, and dealer rental utilization are better signals than the national percentage alone.
The opportunity is real, but it is not evenly distributed.
Roads, power, and transportation are holding up
Several infrastructure categories stayed positive in June. Total highway and street construction rose 2.9% year over year to a $152.1 billion annual rate. Public highway work, which accounts for nearly all of that category, rose 3.1%.
Transportation construction increased 2.2% overall, with public transportation spending up 3.8%. Power construction rose 3.5%, led by a 4.3% gain in private power work. Water supply construction increased 0.9%, including a 1.5% rise on the public side.
These are not explosive numbers, but they show where demand has more support. Contractors exposed to roads, utilities, energy, and public transportation have a different order book from companies dependent on private commercial pads or factory sitework.
Infrastructure work also creates a different ownership question. Long-duration contracts can support dedicated iron when utilization is visible and payment terms are manageable. Shorter or less certain packages may favor rentals, dealer leases, or subcontracted production. The right answer depends on the awarded work, not the size of the funding program behind it.
Public work carries its own friction. Bid timing, bonding, certified payroll, inspection, documentation, and slow payment can strain smaller contractors even when the backlog looks attractive. A machine can be fully utilized and still create a cash problem if receivables stretch while fuel, payroll, transport, and repair bills arrive on time.
Fleet planning needs to include that delay.
Conservation work is growing from a smaller base
Conservation and development construction reached a $16.6 billion annual rate, up 31.8% from June 2025. Public spending makes up nearly the entire category and rose 30.4%.
The percentage is large because the base is much smaller than roads, power, or manufacturing. Still, the direction is worth watching. This category can include resource conservation and development work that calls for excavators, dozers, compact track loaders, mulchers, pumps, haul trucks, and specialized attachments.
Smaller regional contractors may be better positioned for some of this work than they are for a giant factory or data center package. The jobs can be scattered, site-specific, and dependent on local agency procurement. That favors companies that follow bid calendars and maintain the attachments needed for clearing, drainage, erosion control, restoration, and access work.
The trap is chasing the growth rate without checking the local dollars. A 30% increase in a small national category does not justify a purchase by itself. It tells owners where to investigate.
Rental yards should expect uneven utilization
A split construction market creates messy rental data. Fleet utilization can look acceptable in total while specific classes move in opposite directions.
Large earthmoving equipment tied to factory sitework may soften in one region. Compact equipment supporting public maintenance, utility work, and smaller civil packages may remain tight. Generators, light towers, pumps, trench safety equipment, and material handling units can follow yet another cycle.
Rental companies should resist using one branch-wide utilization number to make disposal and purchasing decisions. The useful view is by asset class, branch, customer segment, and job type. A 70% average can hide one fleet at 90% and another at 50%.
Contractors can read rental behavior as a local signal. Frequent availability, aggressive monthly pricing, and dealers calling about idle units suggest a different market from one where reservations stretch weeks out. Those observations do not replace a backlog review, but they can challenge assumptions before an owner signs a note.
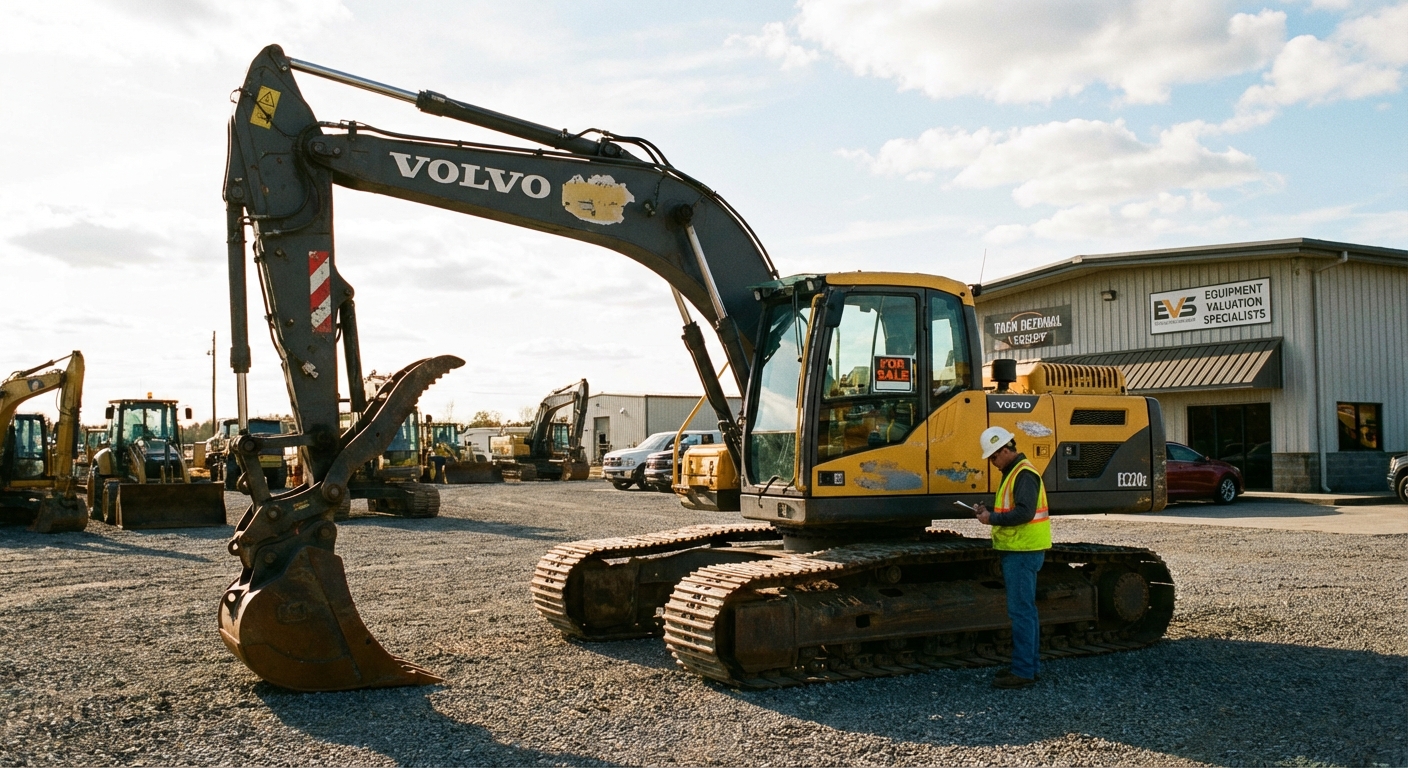
Used equipment supply may also become more uneven. Contractors leaving weak segments can sell late-model units while infrastructure-focused companies keep similar machines busy. Auction results can therefore reflect geography, specifications, attachments, hours, and condition more than a simple national downturn.
What equipment owners should do now
The June report does not say to stop buying equipment. It says broad growth assumptions are dangerous.
First, separate backlog by end market. A contractor with $5 million of work should know how much depends on private residential, commercial, manufacturing, public road, utility, or energy spending. The total backlog number can hide concentration in a weakening segment.
Next, connect each major machine to awarded work. A forecast based on bids submitted is not the same as a schedule built from signed contracts. If a purchase only works when several unawarded jobs land on time, the machine is carrying sales risk that belongs in the decision.
Then review utilization and cost at the asset level. Hours alone are not enough. Owners need repair spend, service intervals, transport cost, attachment wear, downtime, and the labor required to keep the unit producing. A busy machine can still be the wrong machine if it constantly disrupts the crew around it.
Finally, preserve options. Rentals, short-term leases, subcontracted hauling, and delayed purchases have a cost, but so does owning the wrong iron through a changing market. Flexibility has value when end markets are moving in different directions.
The market is local again
For several years, equipment demand was easy to describe in broad terms. Supply was tight, prices rose, backlogs were strong, and almost every machine was in demand. June 2026 shows that the market is becoming more selective.
Manufacturing construction is well below last year’s pace. Residential, lodging, and commercial work are softer. At the same time, office-classified spending, private power, highways, public transportation, and conservation work are growing.
That is not a contradiction. It is a map.
The owners who do well in this phase will not be the ones with the boldest national forecast. They will be the ones who understand which local projects are funded, which packages still need their equipment, and what each machine costs while it waits for the next job.
Data in this article comes from the U.S. Census Bureau’s June 2026 Construction Spending tables, released August 3, 2026. June figures are preliminary and May figures are revised.